Introducing the Docusign Connect Dashboard
The Connect Dashboard provides reporting and analysis on your Connect configurations activity.

Docusign Connect has helped countless customers automate their workflows by using webhooks to build envelope status–based applications specific to their organization’s needs over the past decade. As more businesses use Docusign Developer tools to automate their business processes, Connect has provided the ability to configure additional trigger points allowing their integration between Docusign and external systems to create a seamless digital experience. In our efforts to continue to provide tools to utilize our award-winning APIs, we are pleased to announce our latest feature, the Docusign Connect Dashboard.
The Connect Dashboard is a great way to keep track of the health of your Docusign Connect configurations. By aggregating and displaying data about your event notifications, you can quickly identify problems and take action to resolve them. The Connect Dashboard provides a graphical timeline of your successful and failed event notifications, as well as a log of the specific event notifications generated by a configuration. It also shows metrics for all of the event notifications generated by all of your account configurations, including account- and envelope-level configurations as well as Recipient Connect configuration. This allows you to see at a glance the status of your configurations, identify problems, and quickly take action to resolve them. Thanks to the Connect Dashboard, keeping track of your Docusign Connect configurations has never been easier!
Have you ever wondered what happens after you hit Send on a Docusign document? Once your document is on its way, our Connect feature kicks in to keep you updated on its status. The Connect Dashboard shows metrics for all of the Connect event notifications generated by all of your account's Connect configurations. This includes account- and envelope-level configurations as well as Recipient Connect configurations. The Dashboard shows all of your Connect event notifications, regardless of event format; both Legacy event message formats (Connect 1.0) and JSON SIM event model (Connect 2.0) are supported.
The dashboard is accessible to admin users that manage Connect configurations for their respective accounts. To view the dashboard, users can select Connect under the settings in the Docusign admin portal and select Dashboard:

What business insights can I gain from the dashboard?
The Connect Dashboard displays information about your account's Connect configurations. You can create and apply filters to select the exact set of Connect data that you want to see. Curious if you are having unsuccessful events? Interested in reviewing activity in each of your Connect configurations? With our filters, you can select the data you’d like to review with a few simple clicks. Let’s review a few examples of how to use the dashboard to manage your configurations.
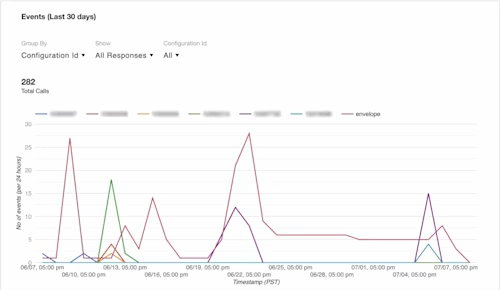
Let’s say you’d like to review all of your event notifications from the last 30 days, grouped by configuration ID. You would group the data by configuration IDs, show all responses including successful and unsuccessful events, and choose the last 30 days as your time frame.

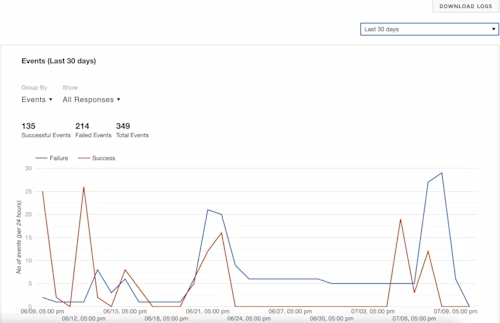
If you are trying to troubleshoot your events and compare successful events to failures, group by events and then display all responses. In this example, you can identify a large number of failures near the end of the 30-day time frame with a few spikes in between that may be useful in pinpointing the high failure rate.

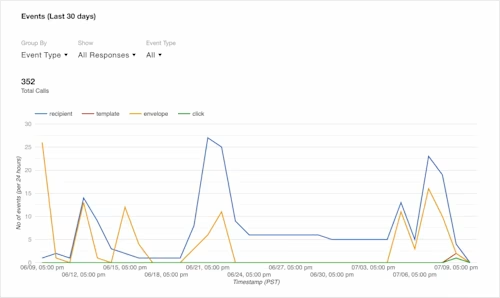
If you would like to audit what event types are being utilized, you can group by event types and all response types. Here a majority of event types are recipient-level events. You can further review the health of the event type in the configuration by selecting successful or unsuccessful responses, enabling you to troubleshoot failed events.

We are delighted to provide the Connect Dashboard as yet another feature in our developer toolkit, and will continue to provide enhancements in the future to create a stronger administrative experience.
We would love to hear what you think! If you have any suggestions on where we should go next in helping you build better products with Docusign, let us know at developers@docusign.com.
Additional resources

Kevin Patel is a Platform Marketing Manager, focused on Docusign Platform and APIs. His focus at Docusign is to market and promote our API platform and tools to business decision makers, developers and integration partners.
Related posts
Docusign IAM is the agreement platform your business needs


