
The new API Dashboard is now available!
Get real-time metrics to monitor the health of your Docusign integrations
Table of contents

We are very excited to announce our new API Dashboard for customers to view, analyze, download, and monitor the health of their API integrations on the Docusign platform.
Within Docusign, use our amazing in-house monitoring system for our telemetry, health alerting, logging, tracking, and debugging. We log more than 10 million events per hour in our system. These events range from network traffic data to API transactions, exceptions, performance metrics, service logs, metadata, and so on. We wanted to give our developers more power to visualize, monitor, and track their API requests, so our team and the platform monitoring team came together to provide API transaction data back to our developers in a very secure way: the API Dashboard.
Until now, developers building integrations with Docusign have had no easy self-service way to obtain information about the health of their applications. As a developer, I like to constantly monitor my service for existing and new updates, get request logs, look into the response details and duration, create health alerts on new features, and so on. This system helps me succeed in my everyday development cycles. We want to provide the same experience to our developers so that they can succeed in creating wonderful products using the Docusign platform. Moreover, customers can only find out that they have exceeded hourly API limits through exceptions that are returned by their API calls.
With the API Dashboard, we enable developers to monitor their integrations and get quantitative and qualitative data for the calls they are making to the Docusign platform. First, we enable developers to see beautiful metrics and charts of their integrations' performance. Second, we surface meaningful granular request and response information, which will be super helpful for our developers to view, debug, or download their recent API calls for applications built on the Docusign platform. Finally, we provide a better experience by showcasing a Go-Live timeline so that our integration key promotion process (the Go-Live process) from the demo environment to production becomes streamlined and smooth. With this feature we have also made some updates to the Apps and Keys page, where you can now see an overview of your application.
The dashboard is accessible to admin users who can log in to eSignature Admin and who manage integration keys for their respective accounts.
On the Apps and Keys page, we show a quick overview with metrics data, which basically is an aggregation of all transactions related to all your integration keys within a 30-day time period. From this view, users can navigate to the API Dashboard by selecting the View button.
The figure below shows the API Dashboard component on the Apps and Keys page (available in demo and production).
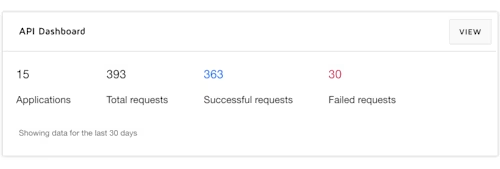
Figure 1: A sneak peek from Apps and Keys
You can also navigate to the API Dashboard for a specific integration key by selecting Actions > View API Dashboard.
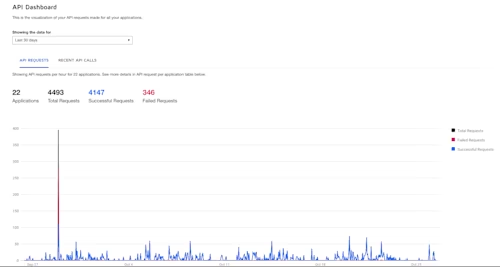
Figure 2: API Dashboard
If you are interested in knowing your recent API call details, you can select the Recent API Calls tab, which shows a transaction datatable. You can also click the totals above the chart, which will take you to a filtered transaction datatable.
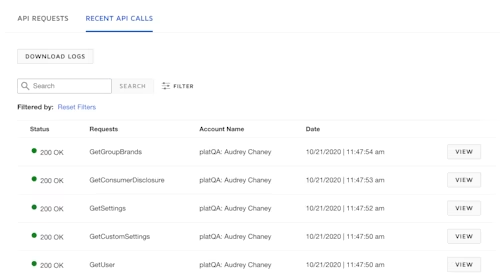
Figure 3: Recent API Calls
Want to know more about these calls? Selecting View on any call will take you to the per-request detail page and give you granular information about that request.
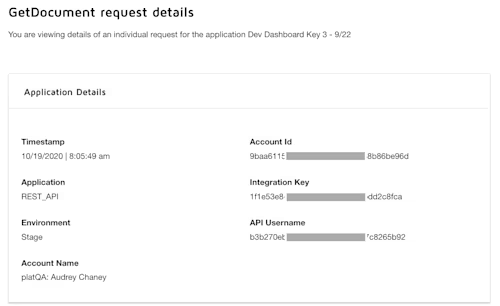
Figure 4: API Request / Response details
We also wanted to provide a search and filter capability, to look for specific transactions. If you click the Filter Icon, you can select what status code you want to filter for, and if you have a lot of integration keys, you can select a specific key to drill down on your search. We also have a text search, which is a simple look up for the Status Code, API Action Name, and Account Name columns in your recent API calls. Please note: As of this writing, the filter option looks for transactions in the client-side only. We are working to extend this very soon so that developers can filter and get filtered data from the API.
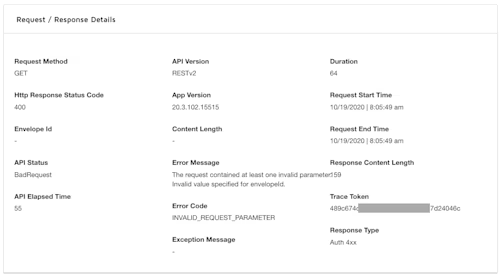
Figure 5: Filter by HTTP Status
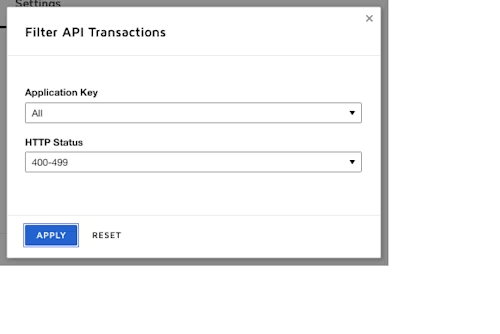
Figure 6: Filter results
This is a bold step in our mission to provide the best-in-class developer experience on our platform. We are very excited about this feature addition to our developer toolkit, and we've got a lot of work and more exciting updates in the coming weeks to make it a better and more meaningful experience.
We would love to hear what you think! If you have any suggestions on where we should go next in helping you build better products with Docusign, let us know at developers@docusign.com.
Additional resources

Bharat Rele leads our developer experience platform team, focusing on building tools that let Docusign developers and partners build on and extend our platform.
Related posts
Docusign IAM is the agreement platform your business needs


