
My experience: Why defensive coding matters
A Docusign core platform engineer shares a hard lesson in coding your processes defensively.

This blog post is part of an ongoing series, From the Inside, which highlights the interesting everyday work of performance and infrastructure platform engineers at Docusign. Every month we sit down with an engineer and ask him/her/they to tell us about an interesting experience: a bug fix, feature shipped, or lesson learned. This week we sat down with software engineer Robert Durst of the Engineering Systems Crew (ESC) team to discuss an interesting performance investigation his team undertook.
Background
Docusign currently uses a hardware load balancing provider and is in the process of exploring a software alternative, HAProxy. As part of this exploration, we introduced a Stream Processing Offloading Agent (SPOA) to the HAProxy stack in order to reach parity with its hardware counterpart. This is essential during an initial mixed-mode topology; as part of the gradual transition we have been running both load balancers simultaneously, sharing traffic between the two.
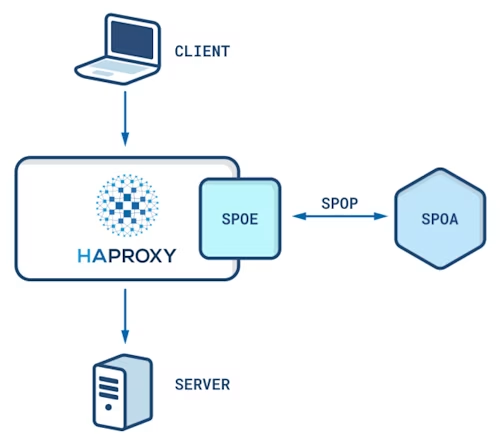
SPOA communicates with HAProxy's Stream Processing Offloading Engine (SPOE) via the Stream Processing Offloading Protocol (SPOP) over TCP, and a single SPOA server sits sidecar to each HAProxy instance. SPOA intercepts and processes every incoming request, executing logic and dictating actions HAProxy should take, such as blocking a request due to a denylisted source IP address. Instead of opting for an existing open-source implementation, we built our own C# SPOA server that best fits our performance requirements.
The problem
We ship SPOA as a Docker container on a Linux host. After noticing a spike in CPU usage on a machine running SPOA, we observed the following output from docker-stats:
CONTAINER ID   NAME              CPU %     PIDS
7d44334e4f7f   spoaserver.8000   200.24%    23
Having 200%+ CPU usage is certainly unexpected and a significant blocker before SPOA can be deployed to production.
Collecting traces: perfcollect
Docusign is still early in its development of running C# services within Linux Docker containers, so we didn’t have an established process to investigate the problem.
Our initial approach involved installing dotnet-trace on the Docker container, waiting for the problem to reproduce, then analyzing the trace. Unfortunately, we not only observed no obvious offender, we also found an inconsistency between dotnet-trace and docker-stats over the CPU utilization of the container. Since dotnet-trace describes just the dotnet process(es) and docker-stats describes the entire container, something else within the container must have been consuming CPU time.
On Linux, Docker containers are simply isolated processes, forked from the main process and thus observable from the root operating system_._ So, what we needed was a tool which captured a trace across all processes and a way to tie Docker container processes and subprocesses together. Enter perfcollect, a Bash script developed and maintained by Microsoft that:
"leverages Linux Tracing Tookit-Next Generation (LTTng) to collect events written from the runtime or any EventSource, as well as perf to collect CPU samples of the target process."
Visualizing traces: flame graphs
Early on in my time at Docusign, my manager, Aaron Tyler, introduced me to the blog of Brenden Gregg. Soon thereafter, I bought Gregg's Systems Performance book and became increasingly familiar with flame graphs. As per Gregg's website:
"Flame graphs are a visualization of profiled software, allowing the most frequent code-paths to be identified quickly and accurately... [t]he x-axis shows the stack profile population … the y-axis shows stack depth, counting from zero at the bottom. Each rectangle represents a stack frame. The wider a frame is, the more often it was present in the stacks. The top edge shows what is on-CPU, and beneath it is its ancestry. The colors are usually not significant, picked randomly to differentiate frames."
It turns out Gregg's FlameGraph generation scripts work perfectly with the output generated from executing the perfcollect script. Thus, we now had a process for collecting and displaying traces:
1. Run perfcollect from root OS       --> perfcollect.zip
2. Unzip (perfcollect.zip)            --> out.perf
3. Stackcollapse (out.perf)           --> out.folded
4. Generate flame graph (out.folded)  --> flamegraph
Note: we run a slightly modified perfcollect script that gathers the PID of Docker processes to generate the .map files required for Docker process symbol resolution when generating flame graphs on a separate machine.
Analyzing traces: an unexpected culprit
With the tooling in place, it was time to find the root cause. Here is the flame graph for the offending SPOA machine, zoomed in on the dotnet process within the Docker container:
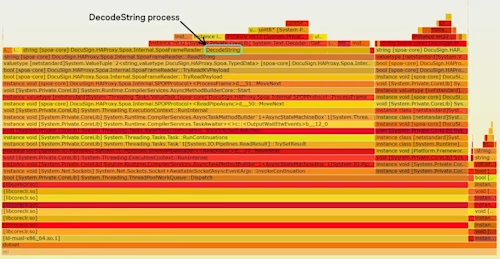
Reviewing the flame graph, it became clear that we spend a TON of time in DecodeString. This was certainly unexpected! Parsing through the source code, Aaron discovered that within the frame parsing code, we continuously read bytes until we read as many as explicitly defined by the incoming frame.
From the SPOP spec:
String := <length><string_value></string_value></length>
Thus, without any sort of defensive coding, we entered an infinite loop triggered by data that adhered to the SPOP protocol, yet violated our assumption of sane input: specifying a string length longer than the string data itself.
With a probable root cause identified, it was time to identify the source of the buggy frames. We looked at our internal monitoring GUI, Kazmon, for help.
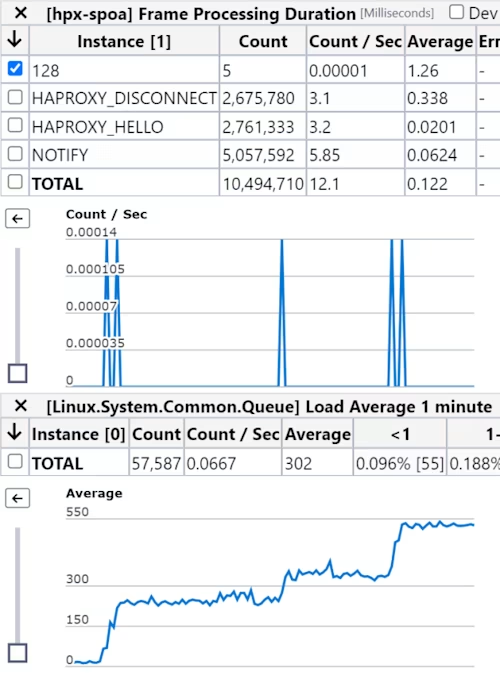
Every time we received a 128 frame type (UNEXPECTED FRAME, i.e. garbage) we saw another CPU get tied up. Furthermore, this happened at almost the exact same time every week.
To further debug and test our infinite loop theory, I did the following:
logged IP of incoming messages, and
added an assertion that the expected string length should be , allowing an early exit in case of receipt of the nonsense data described above.
Not only did we see the assertion throw, meaning we hit this code path, we no longer saw the CPU spikes:
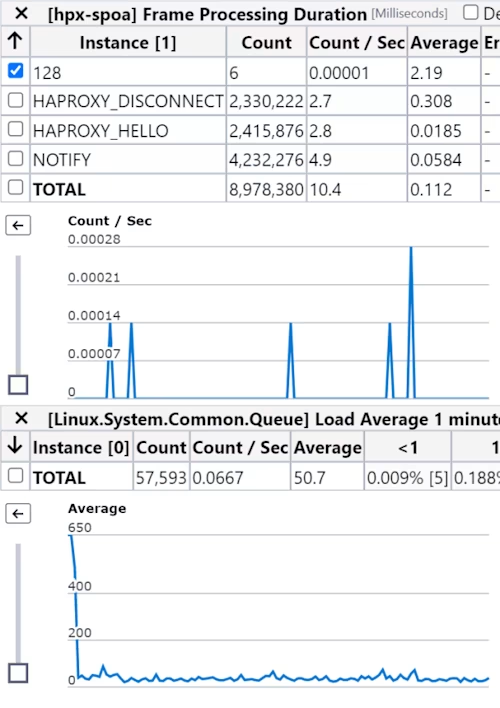
And we caught the offending sender red handed, identified by its IP address.
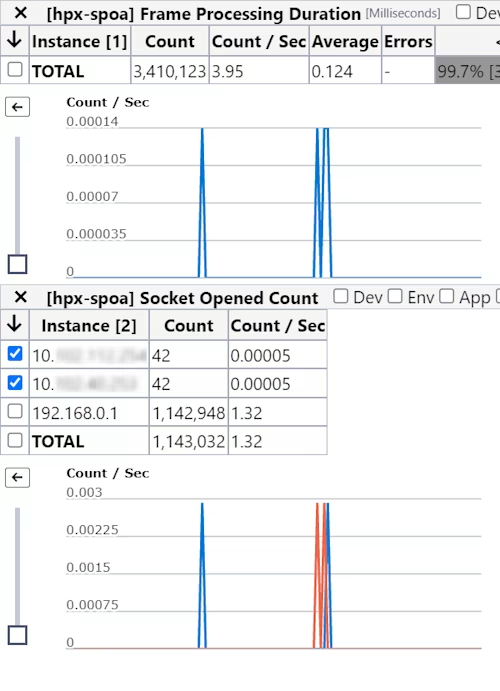
It turns out our vulnerability scanner was sending garbage to SPOA and we'd neglected to harden our implementation against legal, yet impractical message frames.
Takeaways
It turns out dotnet-trace may have been the right tool for this investigation, the buggy code was within the dotnet process. However the ability to generate a flame graph from perfcollect’s output proved invaluable. From this investigation, I developed a rudimentary understanding of Docker container internals and also established a process for future performance investigations. Furthermore, I came away having learned the following lessons:
Defensive coding is essential to protect against unexpected data, especially data that still adheres to the protocol.
Flame graphs are an extremely helpful tool during performance investigations, offering an interactive, single-page visual that can be used to identify anomalies quickly.
If you are interested in this type of work or distributed systems performance in general, check out the open role listings within my organization on the Docusign careers page. We’re hiring!!
Additional resources

Robert Durst joined Docusign after graduating with a B.A. in Computer Science from Colby College in 2020. His main focus is improving the performance of critical infrastructure at the platform level, helping Docusign in its quest for five 9's of availability. Away from work he enjoys paddle boarding around mangrove trees and intercoastal waterways, exploring beautiful Southern Florida.
Related posts
Docusign IAM is the agreement platform your business needs


